Market Outlook
October 30, 2017
Market Cues
Domestic Indices
Chg (%)
(Pts)
(Close)
Indian markets are likely to open Positive tracking global indices and SGX Nifty.
BSE Sensex
0.0
10
33,157
US stock markets hit new peaks on Friday after forecast-beating results from the
Nifty
(0.2)
(21)
10,323
technology companies including Google’s parent company Alphabet, Amazon and
Mid Cap
0.3
45
16,380
Microsoft.
Small Cap
0.3
47
17,304
Bankex
(0.8)
(234)
28,096
The majority of the European markets ended Friday's session with modest gains.
Uncertainty over the future of Catalonia was overshadowed by the continued
weakening of the Euro. The value of the currency has been falling since the
Global Indices
Chg (%)
(Pts)
(Close)
European Central Bank pledged to continue with bond purchases beyond September
Dow Jones
0.3
71
23,401
2018 yesterday, despite strong growth.
Nasdaq
(0.1)
(7)
6,557
FTSE
0.3
19
7,505
Indian shares ended a lackluster session on a flat note Friday as mixed earnings
results prompted traders to book some profits at higher levels after recent sharp
Nikkei
1.2
269
22,008
gains.
Hang Seng
0.8
236
28,439
Shanghai Com
0.3
9
3,417
News Analysis
Maruti Suzuki Q2 net up 3.4% at `2,484cr
Advances / Declines
BSE
NSE
Detailed analysis on Pg2
Advances
1,373
906
Investor’s Ready Reckoner
Declines
1,351
835
Unchanged
147
71
Key Domestic & Global Indicators
Stock Watch: Latest investment recommendations on 150+ stocks
Refer Pg5 onwards
Volumes (` Cr)
BSE
5,595
Top Picks
NSE
36,894
CMP
Target
Upside
Company
Sector
Rating
(`)
(`)
(%)
Blue Star
Capital Goods Accumulate
792
867
9.5
Net Inflows (` Cr)
Net
Mtd
Ytd
Dewan Housing Finance
Financials
Accumulate
612
670
9.6
FII
6,812
349
36,879
Asian Granito
Other
Buy
483
570
18.0
MFs
691
8,851
95,195
Navkar Corporation
Other
Buy
194
265
36.9
KEI Industries
Capital Goods
Buy
324
380
17.2
More Top Picks on Pg4
Top Gainers
Price (`)
Chg (%)
Unitdspr
3,029
17.6
Key Upcoming Events
Previous
Consensus
Fconsumer
61
7.0
Date
Region
Event Description
Reading Expectations
Enginersin
181
7.0
Oct 30
Euro Zone Euro-Zone Consumer Confidence
(1.00)
(1.00)
Sparc
380
6.9
Oct 31
US
Consumer Confidence
119.80
121.00
Oct 31
China
PMI Manufacturing
52.40
52.10
Niittech
644
5.9
Oct 31
Euro Zone Euro-Zone GDP s.a. (QoQ)
0.70
0.50
Nov01
US
Initial Jobless claims
233.00
Top Losers
Price (`)
Chg (%)
More Events on Pg7
Infratel
419
(8.0)
Idbi
62
(8.0)
Pnb
196
(8.0)
Albk
78
(7.8)
Yesbank
307
(7.4)
As on October, 27 2017
Market Outlook
October 30, 2017
News Analysis
Maruti Suzuki Q2 net up 3.4% at `2,484cr
Country's largest carmaker Maruti Suzuki India posted 3.4 per cent rise in net
profit at `2,484.3cr for the second quarter ended September 30. The company
had reported a net profit of `2,401.5cr for the same period of previous fiscal.
Net sales rose 7 per cent to `21,438.1cr for the quarter under review, as against
`20,048.6cr a year ago, Maruti Suzuki India (MSI) said in a statement. The
company said its net profit increased by only 3.4 per cent due to lower non
operating income as the yields of investment were lower compared to last year.
Moreover, there was some impact of commodities and advertisement expenses
along with increase in effective tax rates, it added. During July-September period,
the company sold a total of 4,92,118 vehicles, including 34,717 in overseas
markets, a growth of 17.6 per cent over the same period a year ago.
Economic and Political News
Telangana's `800cr private rail coach factory to generate 2,000 jobs
UP govt raises cane price by 3.3% in FY18
Coast Guard's `32,000cr expansion plan to see higher pvt participation
Corporate News
Indian Oil aims 13.5 mn tonnes of LNG import capacity in 5 years
L&T to set up `500cr missile systems plant for armed forces
ITC Q2 net increases nearly 6% at `2,640cr
PVR Q2 profit down 15% to `25cr
Market Outlook
October 30, 2017
Quarterly Bloomberg Brokers Consensus Estimate
Tata Steel Ltd - Oct 30, 2017
Particulars ( ` cr)
2QFY18E
2QFY17
y-o-y (%)
1QFY18 q-o-q (%)
Sales
32,295
26,370
22.5
29,556
9.3
EBIDTA
5,235
2,901
80.5
4,345
20.5
%
16.2
11.1
14.7
PAT
1,663
(49.3)
-
921
80.6
LIC Housing Finance - Oct 30, 2017
Particulars ( `cr)
2QFY18E
2QFY17
y-o-y (%)
1QFY18 q-o-q (%)
PAT
536
495
8.3
470
14.1
Lupin Ltd - Oct 30, 2017
Particulars ( ` cr)
2QFY18E
2QFY17
y-o-y (%)
1QFY18 q-o-q (%)
Sales
4,055
4,290
(5.5)
3,869
4.8
EBIDTA
870
1,028
(15.4)
768
13.3
%
21.5
23.9
19.9
PAT
443
662
(33.1)
358
23.8
Market Outlook
October 30, 2017
Top Picks HHHHH
Market Cap
CMP
Target
Upside
Company
Rationale
(` Cr)
(`)
(`)
(%)
Strong growth in domestic business due to its leade`hip
in acute therapeutic segment. Alkem expects to launch
Alkem Laboratories
22,328
1,867
2,079
11.3
more products in USA, which bodes for its international
business.
We expect the company would report strong profitability
Asian Granito
1,454
483
570
18.0
owing to better product mix, higher B2C sales and
amalgamation synergy.
Favorable outlook for the AC industry to augur well for
Cooling products business which is out pacing the
Blue Star
7,584
792
867
9.5
market growth. EMPPAC division's profitability to
improve once operating environment turns around.
With a focus on the low and medium income (LMI)
consumer segment, the company has increased its
Dewan Housing Finance
19,175
612
670
9.6
presence in tier-II & III cities where the growth
opportunity is immense.
Loan growth is likely to pick up after a sluggish FY17.
Lower credit cost will help in strong bottom-line growth.
Karur Vysya Bank
7,678
127
180
41.7
Increasing share of CASA will help in NIM
improvement.
High order book execution in EPC segment, rising B2C
KEI Industries
2,521
324
380
17.2
sales and higher exports to boost the revenues and
profitability
Expected to benefit from the lower capex requirement
Music Broadcast
2,157
378
434
14.8
and 15 year long radio broadcast licensing.
Massive capacity expansion along with rail advantage
Navkar Corporation
2,761
194
265
36.9
at ICD as well CFS augur well for the company
Strong brands and distribution network would boost
Siyaram Silk Mills
2,838
605
650
7.4
growth going ahead. Stock currently trades at an
inexpensive valuation.
Market leadership in Hindi news genre and no.
2
viewership ranking in English news genre, exit from the
TV Today Network
2,139
359
435
21.3
radio business, and anticipated growth in ad spends by
corporate to benefit the stock.
After GST, the company is expected to see higher
volumes along with improving product mix. The Gujarat
Maruti Suzuki
2,45,132
8,115
8,658
6.7
plant will also enable higher operating leverage which
will be margin accretive.
We expect loan book to grow at 24.3% over next two
GIC Housing
2,638
490
655
33.7
year; change in borrowing mix will help in NIM
improvement..
Source: Company, Angel Research
Market Outlook
October 30, 2017
Key Upcoming Events
Result Calendar
D ate
C ompany
October 30, 2017
U nited Phosphorus, LMW, HDFC, IDFC, LIC Housi ng Fin., Ce ntral Bank, Marico, T ata Steel, Lupin
October 31, 2017
Blue Star, IDBI Bank, Syndicate Bank, Dabur India, KPIT Cummins, D B Corp, JSW Steel , L G Balakrishnan & Bros
Source: Bloomberg, Angel Research
Global economic events release calendar
Bl oomberg Data
D ate
Time
C ountry
Event Description
Unit
Period
L ast Reporte d
E stimate d
Oct 30, 2017
3:30 PMEuro Zone Euro-Zone Consumer Confidence
Value
Oct F
(1.00)
(1.00)
Oct 31, 2017
7:30 PMUS
Consumer Confidence
S.A./ 1985=100
Oct
119.80
121.00
6:30 AMChina
PMI Manufacturing
Value
Oct
52.40
52.10
3:30 PMEuro Zone Euro-Zone GDP s.a. (QoQ)
% Change
3Q A
0.70
0.50
Nov 01, 2017
6:00 PMUS
Initial Jobless claims
Thousands
Oct 28
233.00
3:00 PMUK
PMI Manufacturing
Value
Oct
55.90
55.90
Nov 02, 2017
11: 30 PMUS
FOMC rate decision
%
Nov 1
1.25
1.25
2:25 PMGermany PMI Manufacturing
Value
Oct F
60.50
60.50
2:25 PMGermany Unempl oyment change (000's)
Thousands
Oct
(22.00)
(10.00)
5:30 PMUK
BOE Announce s rate s
% Ratio
Nov 2
0.25
0.50
Nov 03, 2017
6:00 PMUS
Change in N onfarm payrolls
Thousands
Oct
(33.00)
310.00
6:00 PMUS
Unnemployment rate
%
Oct
4.20
4.20
Nov 06, 2017
2:25 PMGermany PMI Services
Value
Oct F
55.20
Nov 08, 2017
China
Exports YoY%
% Change
Oct
8.10
Nov 09, 2017
7:00 AMChina
Consumer Price Index (YoY)
% Change
Oct
1.60
Source: Bloomberg, Angel Research
Market Outlook
October 30, 2017
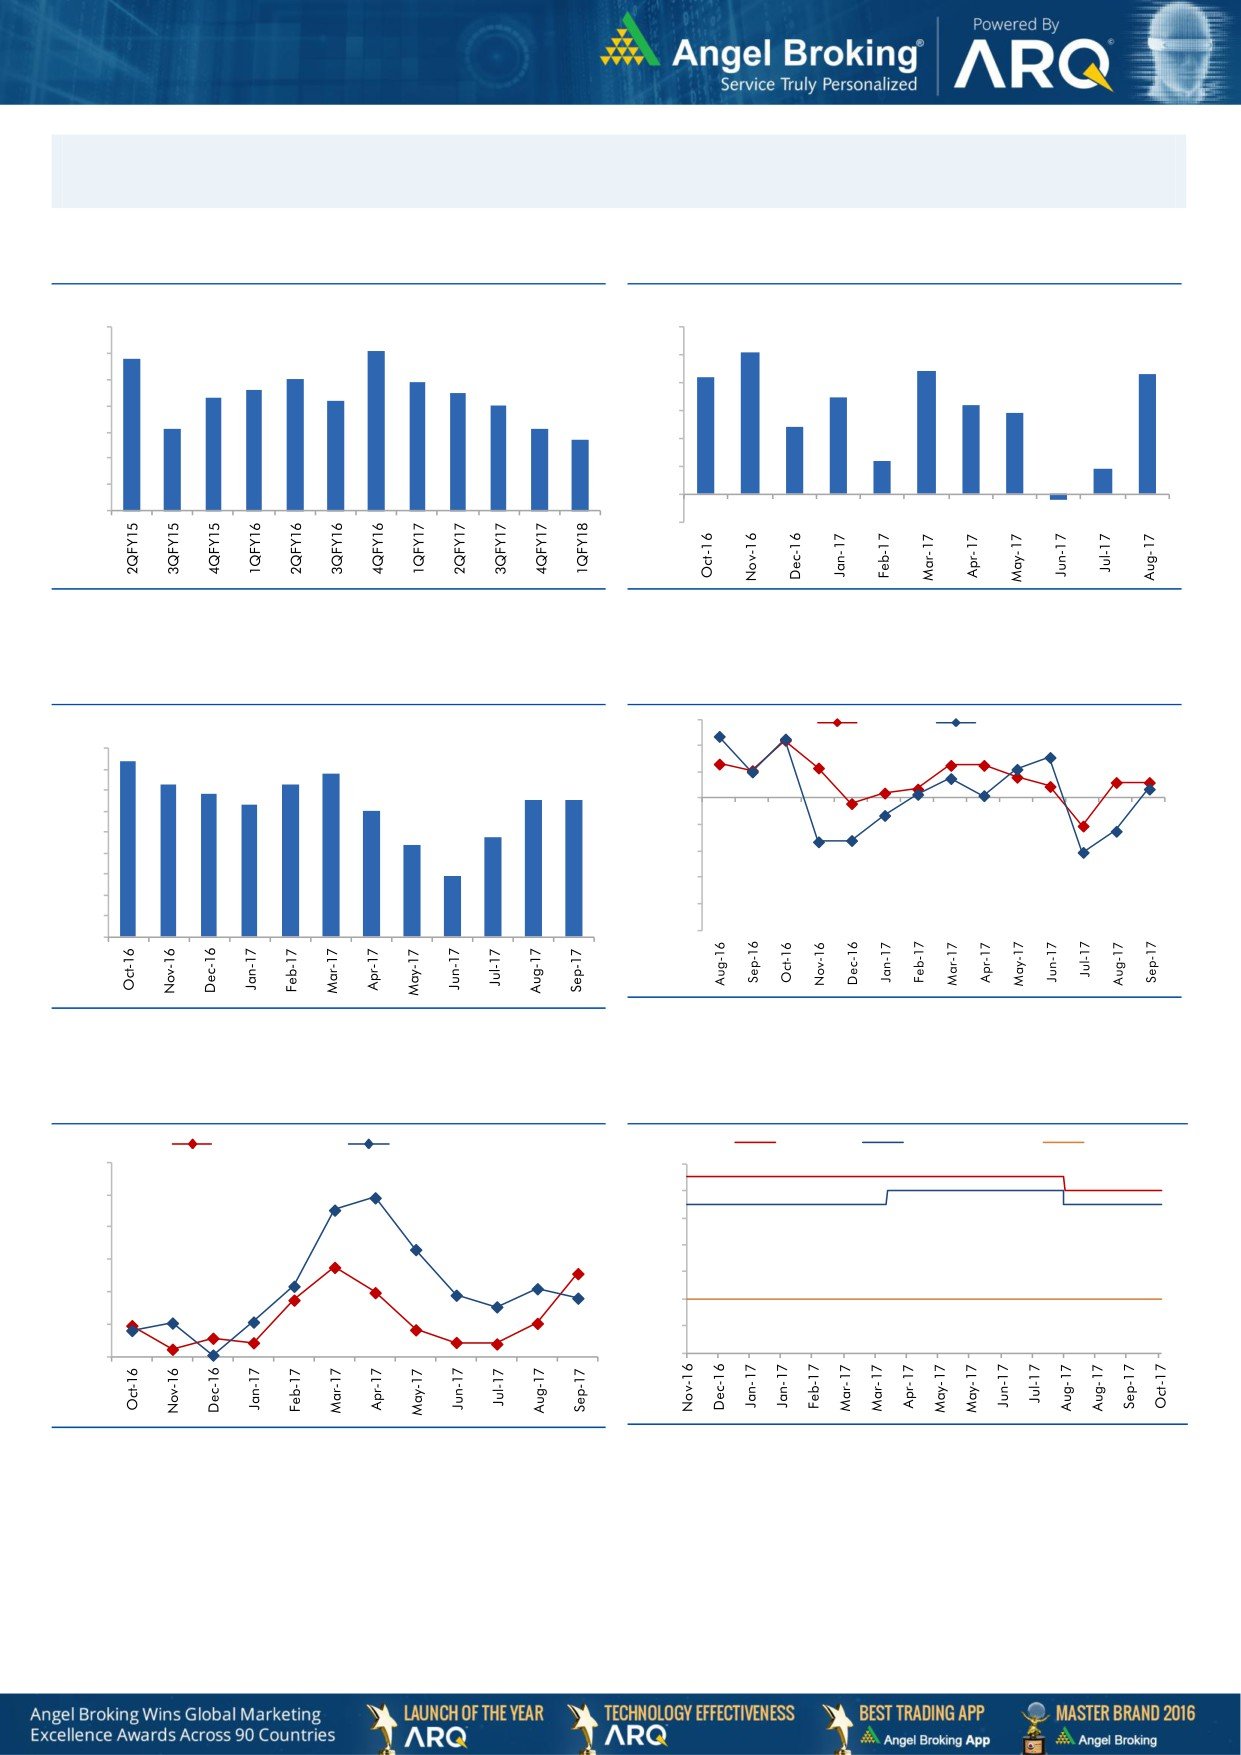
Macro watch
Exhibit 1: Quarterly GDP trends
Exhibit 2: IIP trends
(%)
(%)
10.0
6.0
9.1
5.1
8.8
9.0
5.0
4.4
4.3
8.0
7.9
4.2
7.6
7.5
8.0
7.3
7.2
4.0
3.5
7.0
3.2
2.9
7.0
6.1
6.1
3.0
2.4
5.7
6.0
2.0
1.2
0.9
5.0
1.0
4.0
-
3.0
(1.0)
(0.2)
Source: CSO, Angel Research
Source: MOSPI, Angel Research
Exhibit 3: Monthly CPI inflation trends
Exhibit 4: Manufacturing and services PMI
56.0
Mfg. PMI
Services PMI
(%)
4.5
4.2
54.0
3.9
4.0
3.6
3.7
52.0
3.4
3.3
3.3
3.5
3.2
3.0
50.0
3.0
2.2
2.4
48.0
2.5
2.0
46.0
1.5
1.5
44.0
1.0
42.0
0.5
40.0
-
Source: Market, Angel Research; Note: Level above 50 indicates expansion
Source: MOSPI, Angel Research
Exhibit 5: Exports and imports growth trends
Exhibit 6: Key policy rates
(%)
Exports yoy growth
Imports yoy growth
(%)
Repo rate
Reverse Repo rate
CRR
60.0
6.50
50.0
6.00
5.50
40.0
5.00
30.0
4.50
20.0
4.00
10.0
3.50
0.0
3.00
Source: Bloomberg, Angel Research
Source: RBI, Angel Research
Market Outlook
October 30, 2017
Global watch
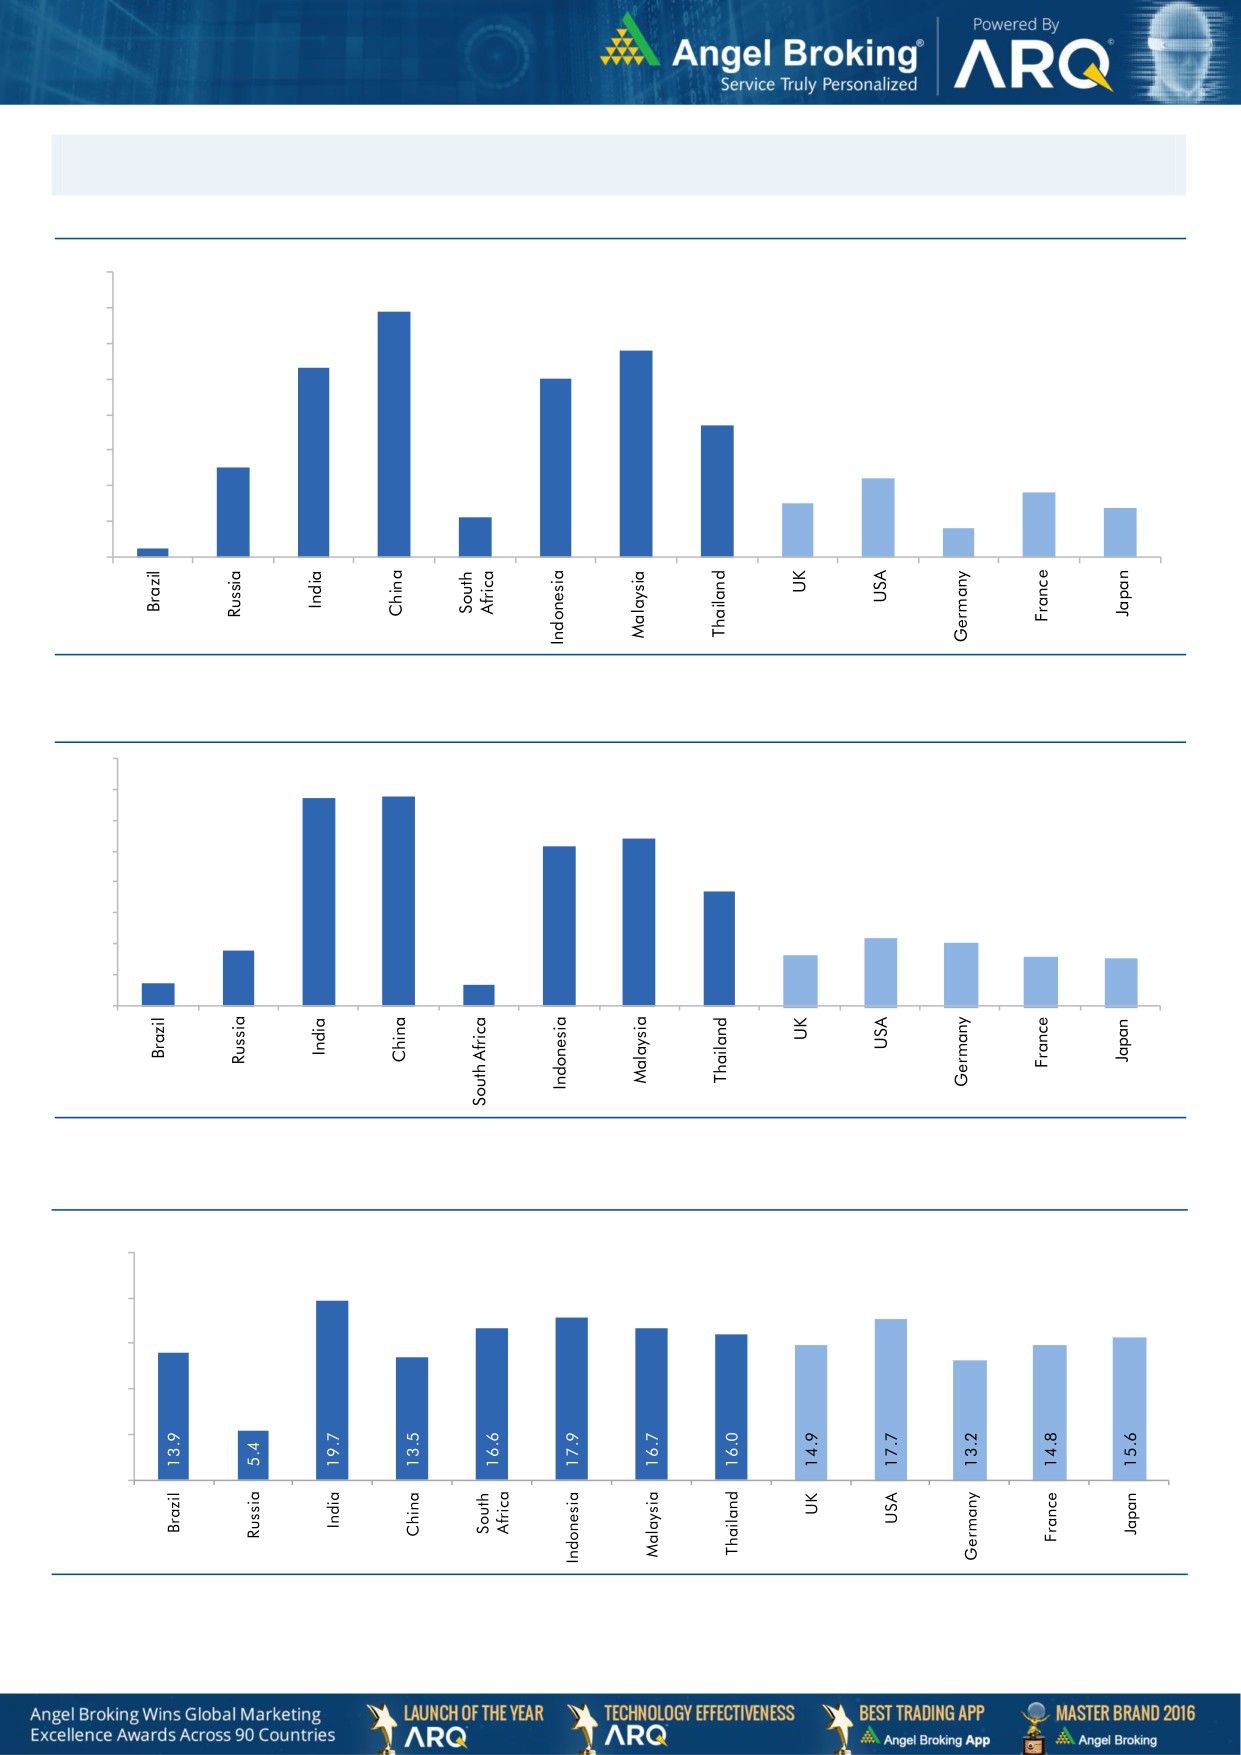
Exhibit 1: Latest quarterly GDP Growth (%, yoy) across select developing and developed countries
(%)
8.0
6.9
7.0
5.8
6.0
5.3
5.0
5.0
1.1
3.7
4.0
2.5
3.0
2.2
1.8
2.0
1.5
1.4
0.8
1.0
0.3
-
Source: Bloomberg, Angel Research
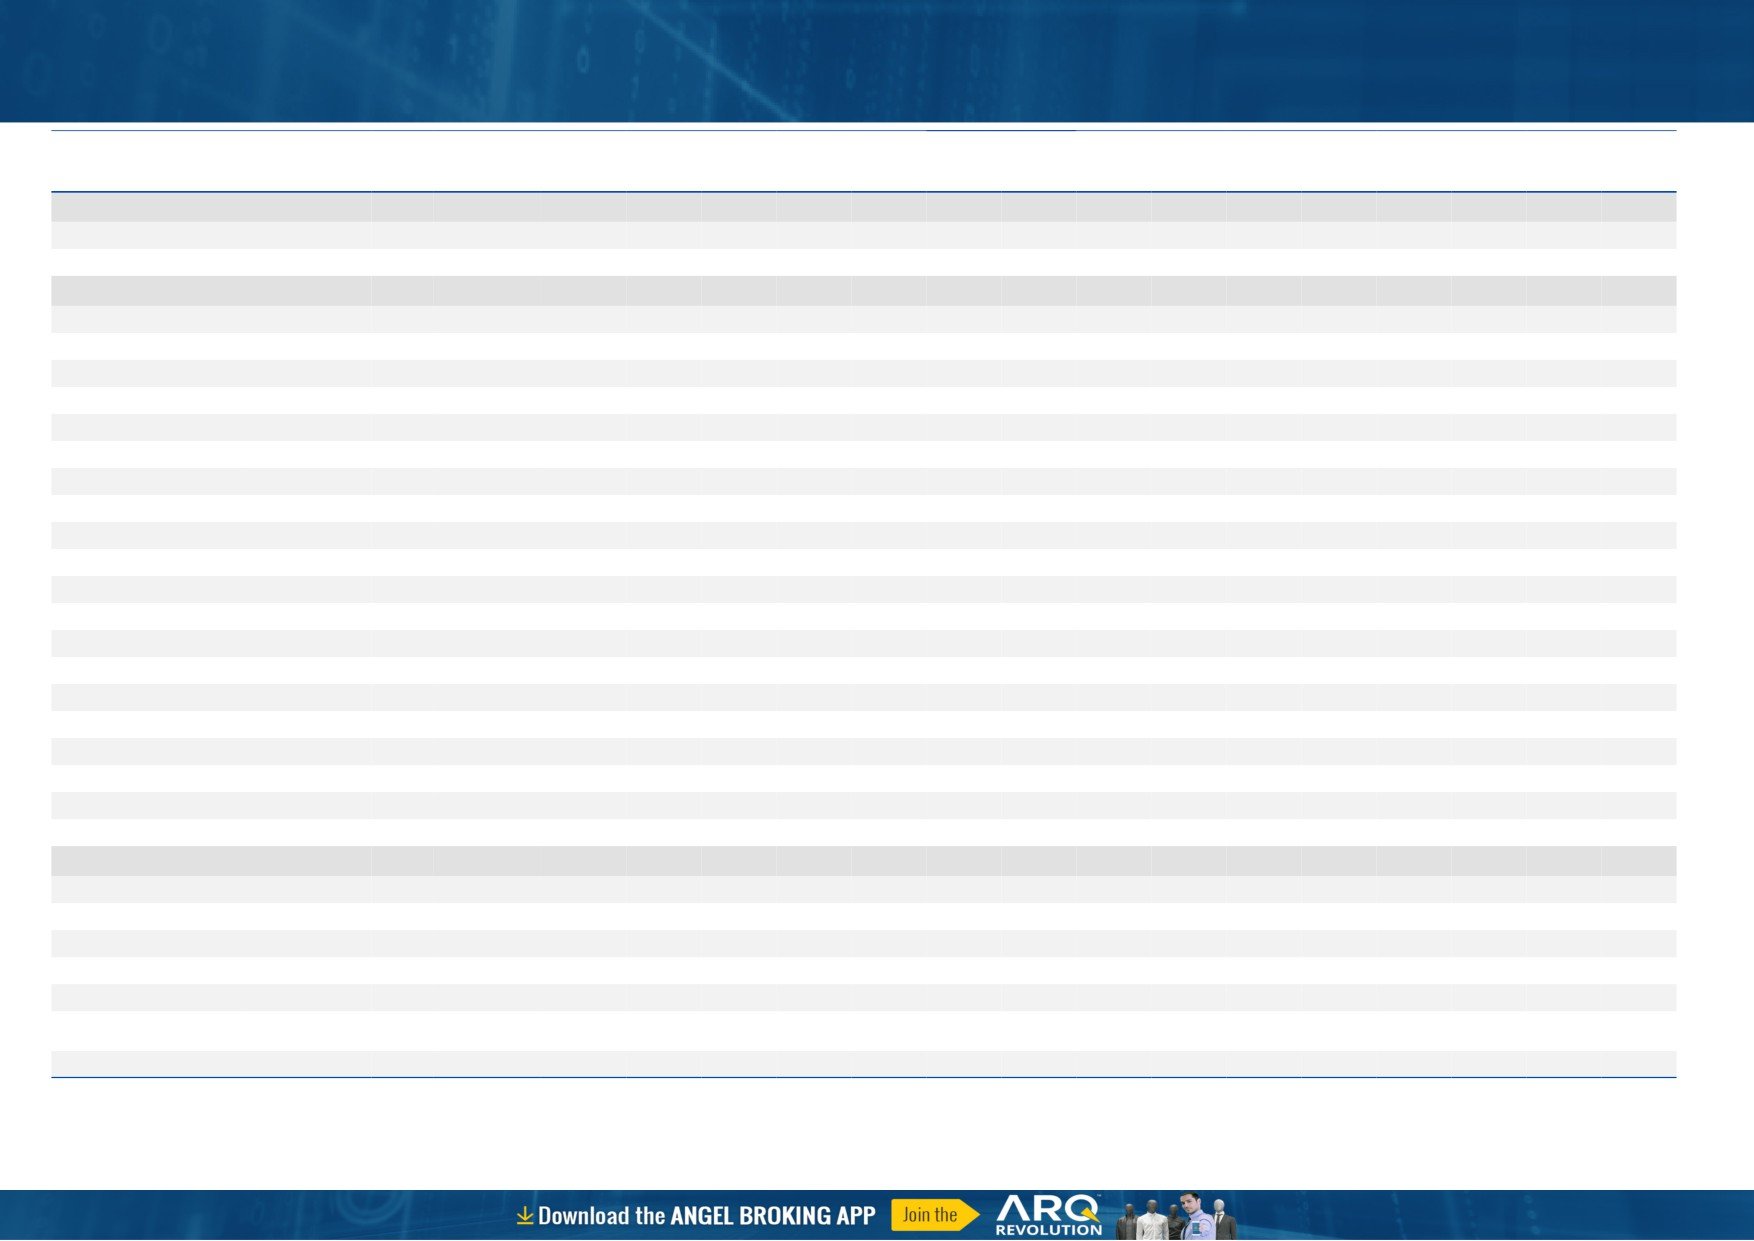
Exhibit 2: 2017 GDP Growth projection by IMF (%, yoy) across select developing and developed countries
(%)
6.7
6.8
7.0
6.0
5.4
5.2
5.0
3.7
4.0
3.0
1.8
2.2
2.0
1.7
1.6
2.0
0.7
1.5
0.7
1.0
-
Source: IMF, Angel Research
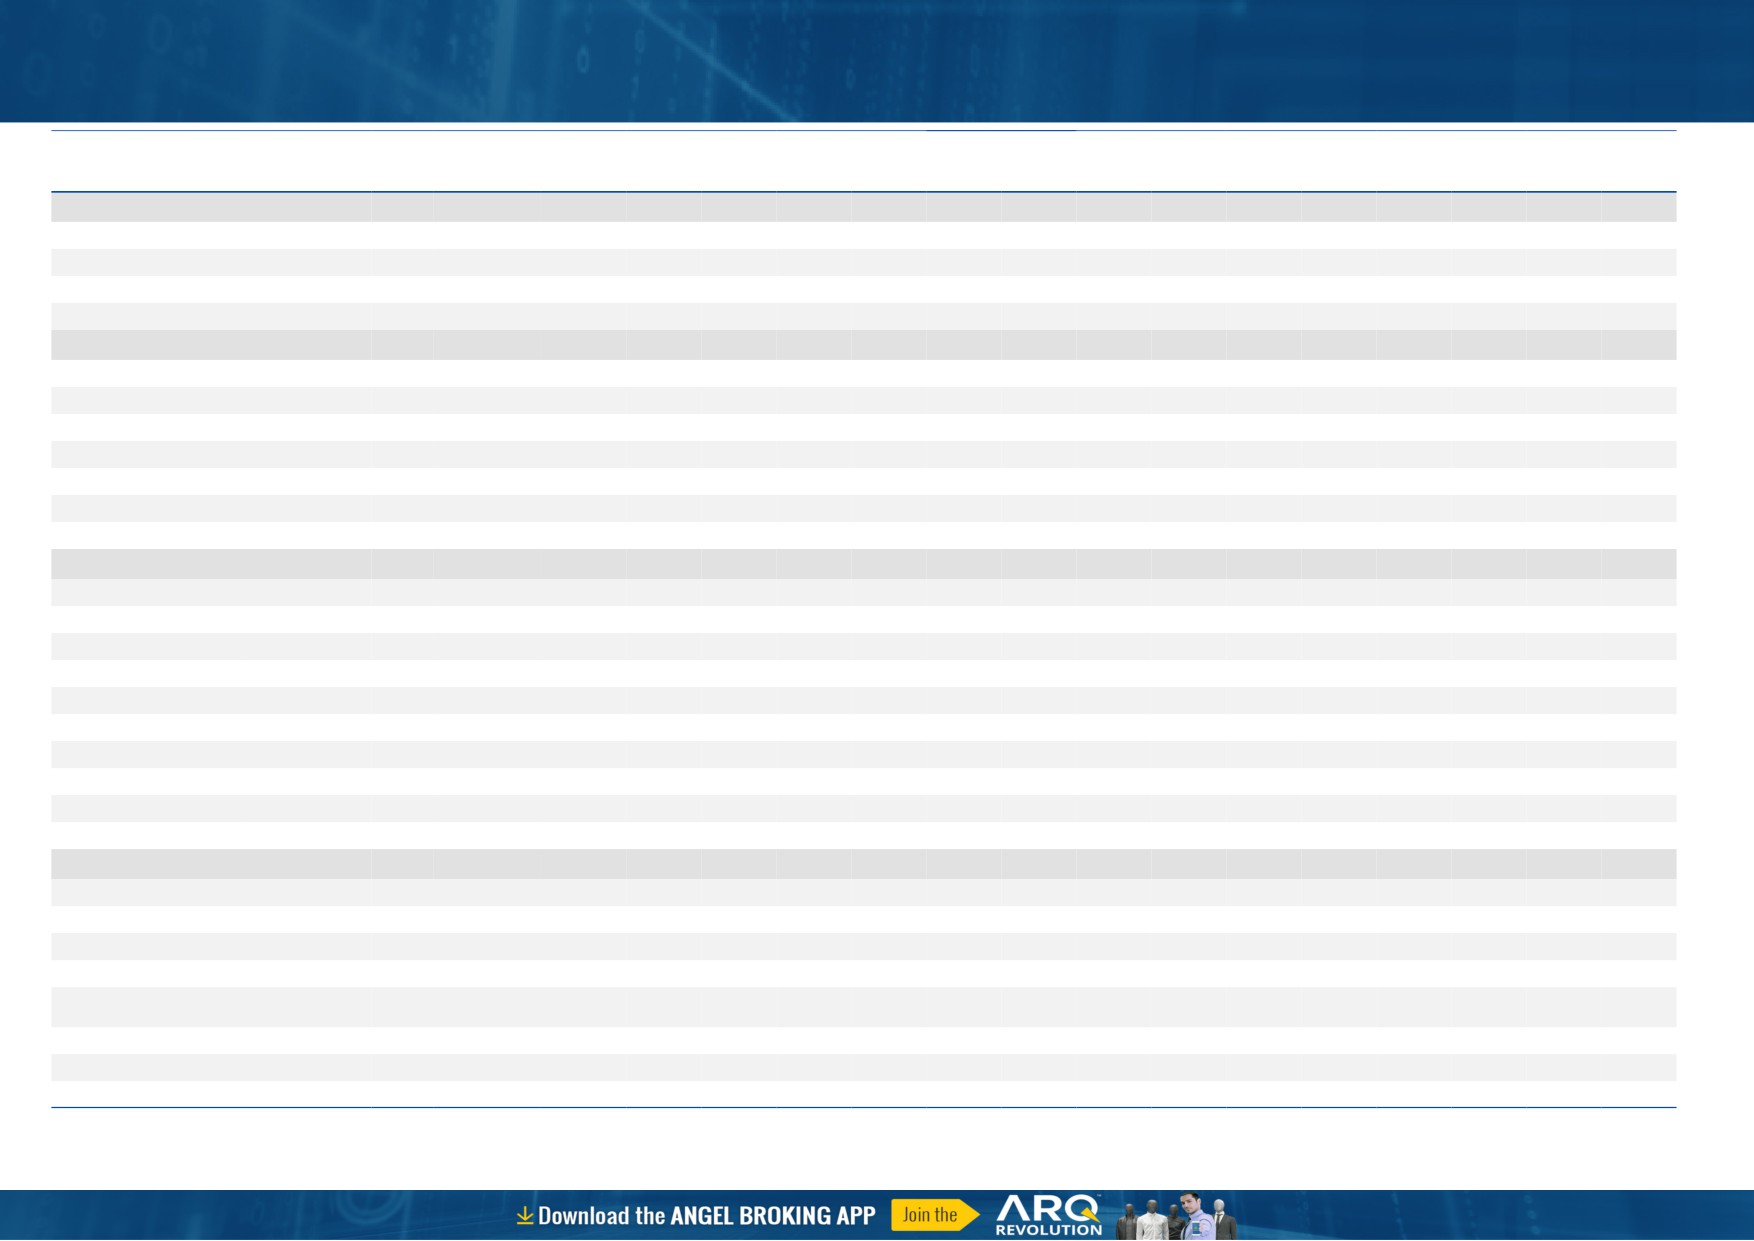
Exhibit 3: One year forward P-E ratio across select developing and developed countries
(x)
25.0
20.0
15.0
10.0
5.0
-
Source: IMF, Angel Research
Stock Watch
October 30, 2017
Company Name
Reco
CMP
Target
Mkt Cap
Sales ( Čcr )
OPM(%)
EPS (Č)
PER(x)
P/BV(x)
RoE(%)
EV/Sales(x)
(Č)
Price ( Č)
( Č cr )
FY18E FY19E
FY18E
FY19E
FY18E
FY19E
FY18E
FY19E
FY18E
FY19E
FY18E
FY19E
FY18E
FY19E
Agri / Agri Chemical
Rallis
Reduce
245
209
4,772
1,873
2,099
15.0
15.0
9.5
10.5
25.8
23.4
3.9
3.6
15.8
16.0
2.4
2.2
United Phosphorus
Neutral
830
-
42,142
18,922
21,949
18.0
18.5
36.2
45.6
22.9
18.2
4.8
4.0
22.7
23.8
2.4
2.0
Auto & Auto Ancillary
Ashok Leyland
Neutral
128
-
37,460
23,339
27,240
10.1
10.8
4.7
6.2
27.5
20.6
5.5
4.9
20.0
23.6
1.6
1.3
Bajaj Auto
Neutral
3,290
-
95,190
23,936
27,955
19.5
20.1
142.7
167.3
23.1
19.7
5.0
4.5
21.8
22.8
3.6
3.0
Bharat Forge
Buy
672
875
31,274
7,637
8,755
21.7
23.2
36.1
47.3
18.6
14.2
3.3
2.8
18.5
20.8
4.0
3.4
Eicher Motors
Neutral
31,783
-
86,521
19,043
22,837
19.5
19.9
835.4
1,019.0
38.1
31.2
14.2
11.0
40.9
37.8
4.4
3.6
Gabriel India
Neutral
197
-
2,836
1,782
2,033
9.7
10.2
7.1
8.9
27.8
22.3
5.6
4.8
21.0
22.2
1.5
1.3
Hero Motocorp
Accumulate
3,797
4,129
75,826
32,239
36,878
16.0
15.6
184.4
206.5
20.6
18.4
6.5
5.7
31.3
30.7
2.1
1.8
Jamna Auto Industries Neutral
66
-
2,614
1,441
1,662
14.4
14.8
13.9
17.6
4.7
3.7
1.3
1.0
30.0
31.0
1.8
1.5
Mahindra and Mahindra Neutral
1,386
-
86,080
46,971
53,816
13.6
14.0
67.7
79.8
20.5
17.4
2.9
2.6
15.0
15.9
1.7
1.4
Maruti
Accumulate
8,115
8,658
245,132
81,825
101,245
15.0
15.0
283.5
356.0
28.6
22.8
6.3
5.1
21.9
22.4
2.7
2.1
Minda Industries
Neutral
812
-
7,015
4,328
5,084
11.0
11.9
27.3
36.4
29.8
22.3
6.3
4.9
23.1
25.6
1.7
1.4
Motherson Sumi
Neutral
358
-
75,270
55,937
64,445
10.8
11.4
16.9
21.1
21.2
17.0
4.7
4.8
25.2
25.4
1.4
1.2
Tata Motors
Neutral
430
-
124,170
303,167
343,649
11.8
13.8
33.1
54.7
13.0
7.9
2.1
1.7
16.9
23.0
0.5
0.4
TVS Motor
Neutral
718
-
34,114
13,992
16,216
9.0
9.4
17.1
20.3
42.1
35.4
11.2
8.7
29.7
27.7
2.4
2.0
Amara Raja Batteries
Buy
685
858
11,699
6,140
7,122
14.3
15.6
29.3
39.0
23.4
17.6
4.0
3.3
17.1
19.0
1.9
1.6
Exide Industries
Neutral
203
-
17,268
8,689
9,854
15.1
15.2
9.7
11.0
21.1
18.5
3.7
3.3
15.7
16.1
1.7
1.5
Apollo Tyres
Neutral
244
-
12,397
15,739
17,326
13.3
14.6
20.4
26.7
11.9
9.1
1.5
1.3
20.4
26.7
1.0
0.9
Ceat
Neutral
1,685
-
6,814
6,661
7,717
11.1
14.2
116.2
178.2
14.5
9.5
2.5
2.1
15.2
21.3
1.1
1.0
JK Tyres
Neutral
146
-
3,313
8,318
9,239
16.2
16.4
21.0
27.5
7.0
5.3
1.4
1.1
19.1
20.4
0.8
0.7
Swaraj Engines
Neutral
2,005
-
2,490
788
889
16.4
16.5
71.6
81.0
28.0
24.8
8.1
7.5
29.6
31.0
2.8
2.4
Subros
Neutral
263
-
1,575
1,855
2,135
11.6
11.8
10.3
14.7
25.6
17.9
3.9
3.3
15.8
19.1
1.1
0.9
Capital Goods
BEML
Neutral
1,705
-
7,101
4,286
5,194
7.1
8.2
42.9
58.1
39.7
29.4
3.3
3.0
7.6
8.7
1.7
1.4
Bharat Electronics
Neutral
172
-
42,334
10,258
12,470
19.6
19.5
7.3
8.6
23.6
20.0
0.5
0.4
20.4
21.9
3.6
2.9
Voltas
Neutral
543
-
17,964
6,778
8,004
9.6
11.0
17.1
22.4
31.8
24.2
7.6
6.6
17.7
19.8
2.3
2.0
BHEL
Neutral
95
-
34,952
33,200
39,167
6.8
9.5
6.2
11.2
15.4
8.5
0.7
0.7
4.6
8.0
0.6
0.5
Blue Star
Accumulate
792
867
7,584
5,220
6,207
6.3
6.6
16.8
22.3
47.1
35.5
9.4
8.3
19.9
23.3
1.4
1.2
CG Power and Industrial
Neutral
82
-
5,130
6,555
7,292
7.5
7.5
-
0.8
8,185.0
102.3
1.3
1.3
0.1
1.2
0.9
0.8
Solutions
Greaves Cotton
Neutral
131
-
3,198
1,778
1,993
14.7
15.1
8.1
9.1
16.2
14.4
3.6
3.4
21.8
23.6
1.6
1.4
Stock Watch
October 30, 2017
Company Name
Reco
CMP
Target
Mkt Cap
Sales ( Čcr )
OPM(%)
EPS (Č)
PER(x)
P/BV(x)
RoE(%)
EV/Sales(x)
(Č)
Price ( Č)
( Č cr )
FY18E FY19E
FY18E
FY19E
FY18E
FY19E
FY18E
FY19E
FY18E
FY19E
FY18E
FY19E
FY18E
FY19E
Capital Goods
KEC International
Buy
298
350
7,657
9,779
11,113
9.4
9.8
14.2
18.2
21.0
16.4
4.0
3.3
21.1
22.1
1.0
0.9
KEI Industries
Buy
324
380
2,521
3,001
3,391
10.0
10.0
13.0
16.1
24.9
20.1
4.5
3.8
18.2
18.7
1.0
0.9
Thermax
Neutral
987
-
11,755
4,125
4,747
10.3
10.8
26.7
31.5
37.0
31.3
4.1
3.8
11.2
12.0
2.6
2.2
VATech Wabag
Buy
591
681
3,225
3,867
4,126
9.6
10.0
34.9
39.8
16.9
14.8
2.8
2.4
17.7
17.5
0.9
0.8
Cement
ACC
Neutral
1,786
-
33,538
12,255
13,350
13.5
14.3
58.0
66.2
30.8
27.0
3.6
3.4
11.5
12.2
2.7
2.5
Ambuja Cements
Neutral
279
-
55,439
10,250
11,450
17.5
19.0
7.2
8.3
38.8
33.6
2.8
2.6
7.0
7.8
5.2
4.6
India Cements
Neutral
195
-
6,023
6,135
6,750
14.8
15.2
8.5
11.5
23.0
17.0
1.1
1.1
4.8
6.2
1.3
1.2
JK Cement
Neutral
1,005
-
7,026
4,150
4,775
19.2
20.0
49.0
63.5
20.5
15.8
3.2
2.8
17.0
18.5
2.1
1.8
J K Lakshmi Cement
Neutral
443
-
5,210
3,422
3,757
15.5
17.0
13.5
23.2
32.8
19.1
3.4
2.9
10.8
15.5
1.9
1.7
Orient Cement
Neutral
171
-
3,504
2,215
3,233
16.8
17.0
5.9
6.9
29.0
24.8
2.2
2.1
10.8
10.1
2.6
1.7
UltraTech Cement
Neutral
4,435
-
121,767
28,250
35,150
20.2
23.5
77.5
122.2
57.2
36.3
4.8
4.4
9.6
14.8
4.8
3.8
Construction
KNR Constructions
Neutral
254
-
3,566
1,846
2,203
14.5
14.5
12.1
13.7
21.0
18.6
1.2
1.0
17.5
16.7
2.0
1.6
Larsen & Toubro
Neutral
1,224
-
171,357
95,787
109,476
10.2
11.6
44.5
50.8
27.5
24.1
3.5
3.2
12.9
13.1
2.3
2.1
Gujarat Pipavav Port
Neutral
139
-
6,727
739
842
61.6
62.7
5.1
6.2
27.3
22.6
3.4
3.3
12.7
14.9
8.6
7.4
PNC Infratech
Neutral
184
-
4,723
2,040
2,935
13.0
13.0
6.4
9.0
28.8
20.5
0.8
0.7
9.7
12.2
2.3
1.7
Simplex Infra
Neutral
526
-
2,603
6,012
6,619
11.6
11.7
21.1
31.0
25.0
17.0
1.7
1.6
6.5
8.6
1.0
0.9
Sadbhav Engineering
Neutral
316
-
5,428
3,823
4,426
10.7
10.8
10.3
11.8
30.7
26.8
3.7
3.2
10.1
10.5
1.7
1.5
NBCC
Neutral
255
-
22,991
9,099
12,706
6.4
6.4
7.3
9.6
35.1
26.7
1.6
1.2
27.5
30.5
2.4
1.7
MEP Infra
Neutral
100
-
1,618
2,403
2,910
18.3
16.8
2.4
6.1
42.3
16.4
16.1
10.8
35.2
55.8
1.8
1.5
SIPL
Neutral
113
-
3,963
2,060
2,390
46.8
47.7
(5.8)
(3.1)
4.2
4.8
(14.2)
(2.3)
6.7
6.2
Engineers India
Neutral
181
-
12,224
1,795
2,611
21.1
22.4
5.9
8.1
30.8
22.4
2.2
2.1
12.9
16.1
5.2
3.4
Financials
Axis Bank
Buy
485
580
116,163
32,558
35,843
3.5
3.2
27.8
41.0
17.4
11.8
1.9
1.7
11.4
14.9
-
-
Bank of Baroda
Neutral
174
-
40,162
22,533
26,079
2.4
2.4
12.0
20.9
14.5
8.3
0.9
0.9
6.6
11.0
-
-
Canara Bank
Neutral
404
-
24,116
17,925
20,235
2.0
2.1
18.5
36.5
21.8
11.1
0.8
0.8
3.4
6.2
-
-
Can Fin Homes
Buy
496
2,128
6,598
586
741
3.5
3.5
107.8
141.0
4.6
3.5
1.0
0.8
24.1
25.6
-
-
Cholamandalam Inv. &
Accumulate
1,124
1,230
17,561
2,826
3,307
6.3
6.3
53.7
64.6
20.9
17.4
3.6
3.0
18.3
18.9
-
-
Fin. Co.
Dewan Housing Finance Accumulate
612
670
19,175
2,676
3,383
2.4
2.7
37.4
49.7
16.4
12.3
2.1
1.9
13.8
16.2
-
-
Equitas Holdings
Buy
144
235
4,879
1,125
1,380
9.6
9.8
1.5
6.0
96.0
24.0
2.2
2.0
2.4
8.2
-
-
Federal Bank
Neutral
120
-
23,425
4,896
5,930
2.8
3.1
5.4
7.6
22.4
15.9
1.9
1.8
8.5
11.0
-
-
Stock Watch
October 30, 2017
Company Name
Reco
CMP
Target
Mkt Cap
Sales ( Čcr )
OPM(%)
EPS (Č)
PER(x)
P/BV(x)
RoE(%)
EV/Sales(x)
(Č)
Price ( Č)
( Č cr )
FY18E FY19E
FY18E
FY19E
FY18E
FY19E
FY18E
FY19E
FY18E
FY19E
FY18E
FY19E
FY18E
FY19E
Financials
GIC Housing
Buy
492
655
2,647
376
477
3.6
3.7
33.0
40.0
14.9
12.3
2.7
2.3
20.0
23.0
-
-
HDFC Bank
Neutral
1,793
-
463,337
55,236
63,253
4.5
4.4
68.9
82.4
26.0
21.8
4.5
3.8
18.7
18.5
-
-
ICICI Bank
Neutral
301
-
193,094
42,361
51,378
3.6
3.9
18.4
25.7
16.4
11.7
1.8
1.7
11.3
15.0
-
-
Karur Vysya Bank
Buy
127
180
7,678
3,289
3,630
3.7
3.9
10.8
14.1
11.7
9.0
1.4
1.3
12.5
14.7
-
-
LIC Housing Finance
Neutral
614
-
31,009
4,895
6,332
3.4
3.7
50.7
66.8
12.1
9.2
2.4
2.0
21.7
23.8
-
-
Punjab Natl.Bank
Neutral
196
-
41,761
23,708
25,758
2.1
2.1
5.9
16.4
33.4
12.0
1.0
0.9
3.0
8.3
-
-
RBL Bank
Neutral
524
-
21,663
2,309
2,888
2.6
2.5
16.4
19.1
32.1
27.5
4.0
3.6
13.3
13.8
-
-
Repco Home Finance
Buy
600
825
3,756
496
597
4.4
4.2
38.5
48.7
15.6
12.3
2.8
2.3
19.6
20.6
-
-
South Ind.Bank
Neutral
31
-
5,594
3,195
3,567
3.0
3.1
3.0
3.8
10.3
8.1
1.0
0.9
10.5
11.9
-
-
St Bk of India
Neutral
311
-
268,414
105,827
121,056
2.4
2.5
16.1
25.6
19.3
12.2
1.5
1.4
6.6
9.9
-
-
Union Bank
Neutral
176
-
12,752
14,650
16,225
2.3
2.3
23.1
32.5
7.6
5.4
0.6
0.5
7.1
9.2
-
-
Yes Bank
Neutral
307
-
70,353
11,088
13,138
3.0
2.9
84.0
99.3
3.7
3.1
0.6
0.5
16.3
16.8
-
-
FMCG
Akzo Nobel India
Neutral
1,848
-
8,863
3,164
3,607
13.8
13.7
58.6
67.9
31.5
27.2
7.7
6.8
24.5
25.1
2.7
2.3
Asian Paints
Neutral
1,187
-
113,866
17,603
20,615
18.6
18.6
2,128.9
2,543.3
0.6
0.5
11.8
9.9
28.0
28.9
6.3
5.3
Britannia
Neutral
4,589
-
55,095
9,690
11,278
14.8
15.4
84.0
101.0
54.6
45.4
19.9
15.8
40.6
39.0
5.6
4.8
Colgate
Neutral
1,057
-
28,761
4,420
5,074
24.9
25.3
28.6
32.8
37.0
32.2
14.6
11.8
43.8
40.5
6.3
5.4
Dabur India
Neutral
322
-
56,800
8,346
9,344
19.6
19.9
7.8
9.0
41.3
35.8
8.3
7.5
25.2
24.8
6.4
5.6
GlaxoSmith Con*
Neutral
4,927
-
20,723
5,072
5,760
18.2
18.4
176.3
199.2
28.0
24.7
5.9
5.4
21.2
21.7
3.4
2.9
Godrej Consumer
Neutral
925
-
63,016
10,171
11,682
20.8
21.5
21.7
27.1
42.6
34.1
9.6
8.2
22.3
23.4
6.3
5.4
HUL
Neutral
1,257
-
272,161
37,077
41,508
20.3
21.8
5,189.9
6,318.5
0.2
0.2
38.3
32.7
74.8
82.0
7.2
6.4
ITC
Neutral
269
-
328,077
44,588
49,853
37.0
37.3
9.6
11.0
28.1
24.5
6.9
6.6
25.1
27.3
6.8
6.1
Marico
Neutral
311
-
40,114
6,788
7,766
18.5
19.2
7.1
8.5
43.8
36.6
15.3
13.1
36.9
38.0
5.8
5.0
Nestle*
Neutral
7,166
-
69,089
10,083
11,182
20.0
20.9
119.7
141.3
59.9
50.7
211.0
192.8
36.7
39.8
6.5
5.8
Tata Global
Neutral
221
-
13,916
7,121
7,641
11.9
12.3
6.9
8.0
32.0
27.6
2.1
2.0
6.8
7.2
1.8
1.6
Procter & Gamble
Neutral
8,620
-
27,981
3,034
3,579
27.1
27.7
167.7
198.8
51.4
43.4
13.8
11.9
28.8
29.5
8.6
7.2
Hygiene
IT
HCL Tech^
Buy
858
1,014
122,393
52,342
57,053
20.9
20.9
62.8
67.6
13.7
12.7
3.1
2.6
22.4
20.6
2.0
1.7
Infosys
Buy
947
1,179
217,629
73,963
80,619
26.0
26.0
64.4
69.3
14.7
13.7
2.9
2.7
19.7
19.6
2.4
2.1
TCS
Neutral
2,579
-
508,213
127,403
138,870
27.6
27.6
144.5
156.0
17.9
16.5
5.3
4.9
29.7
29.8
3.7
3.3
Tech Mahindra
Accumulate
476
533
46,462
31,015
33,496
15.0
15.0
35.6
38.1
13.4
12.5
2.3
2.1
17.0
16.3
1.3
1.1
Stock Watch
October 30, 2017
Company Name
Reco
CMP
Target
Mkt Cap
Sales ( Čcr )
OPM(%)
EPS (Č)
PER(x)
P/BV(x)
RoE(%)
EV/Sales(x)
(Č)
Price ( Č)
( Č cr )
FY18E FY19E
FY18E
FY19E
FY18E
FY19E
FY18E
FY19E
FY18E
FY19E
FY18E
FY19E
FY18E
FY19E
IT
Wipro
Neutral
297
-
144,346
58,536
61,858
20.3
20.3
18.2
19.1
16.3
15.5
2.5
2.2
14.6
13.4
2.4
2.3
Media
D B Corp
Neutral
369
-
6,792
2,404
2,625
30.5
31.5
23.7
26.9
15.6
13.7
3.7
3.1
23.5
22.8
2.7
2.4
HT Media
Neutral
102
-
2,385
2,589
2,830
15.1
15.4
8.3
10.9
12.3
9.4
1.0
0.9
8.4
10.4
0.5
0.3
Jagran Prakashan
Buy
180
225
5,891
2,541
2,835
28.5
28.7
12.7
14.1
14.2
12.8
2.9
2.6
21.3
21.4
2.2
1.9
Sun TV Network
Neutral
842
-
33,200
3,238
3,789
51.9
55.1
30.9
38.0
27.3
22.2
7.8
6.8
30.0
31.0
9.8
8.2
Hindustan Media
Neutral
240
-
1,761
1,002
1,074
23.3
23.5
29.2
33.8
8.2
7.1
1.3
1.1
15.6
15.4
0.8
0.5
Ventures
TV Today Network
Buy
357
435
2,129
667
727
27.7
27.7
18.6
20.1
19.2
17.8
3.0
3.1
15.6
17.3
2.7
2.6
Music Broadcast Limited Accumulate
378
434
2,157
271
317
91.0
109.0
6.0
10.0
63.0
37.8
3.9
3.6
6.5
9.3
7.5
6.2
Metals & Mining
Coal India
Neutral
291
-
180,542
82,301
91,235
17.0
18.0
17.1
20.5
17.0
14.2
3.2
3.0
45.0
55.0
1.9
1.7
Hind. Zinc
Neutral
316
-
133,499
22,108
24,555
57.0
58.0
22.1
26.3
14.3
12.0
4.6
3.8
32.0
35.0
5.0
4.2
Hindalco
Neutral
271
-
60,701
102,350
105,355
13.5
14.5
21.5
24.5
12.6
11.0
1.7
1.5
15.0
15.2
1.2
1.1
JSW Steel
Neutral
265
-
64,153
64,500
68,245
21.1
21.5
20.1
21.2
13.2
12.5
2.4
2.1
-
-
1.7
1.6
NMDC
Neutral
129
-
40,767
10,209
11,450
47.0
48.0
11.1
12.1
11.6
10.7
1.6
1.5
-
-
3.5
3.2
SAIL
Neutral
80
-
33,020
54,100
63,555
3.0
10.0
(10.0)
1.5
53.3
1.1
1.1
-
-
1.6
1.4
Vedanta
Neutral
340
-
126,329
81,206
87,345
28.0
29.0
26.5
33.5
12.8
10.1
2.9
2.5
-
-
2.3
2.0
Tata Steel
Neutral
726
-
70,535
121,445
126,500
16.2
17.2
65.4
81.3
11.1
8.9
1.8
1.5
-
-
1.1
1.0
Oil & Gas
GAIL
Neutral
471
-
79,635
53,115
52,344
14.2
15.3
30.0
31.1
15.7
15.1
2.0
1.8
-
-
1.2
1.2
ONGC
Neutral
184
-
235,554
83,111
84,934
44.2
44.9
16.4
16.9
11.2
10.9
1.4
1.3
-
-
2.7
2.7
Indian Oil Corp
Neutral
415
-
201,496
396,116
432,560
8.5
8.8
40.1
42.2
10.4
9.8
1.8
1.6
-
-
0.7
0.6
Reliance Industries
Neutral
929
-
604,496
257,711
267,438
17.0
18.2
89.1
89.5
10.4
10.4
1.0
0.9
-
-
2.0
1.9
Pharmaceuticals
Alembic Pharma
Buy
498
600
9,392
3,903
4,584
18.2
19.2
21.8
27.2
22.9
18.3
4.2
3.5
19.8
20.6
2.4
2.1
Alkem Laboratories Ltd
Accumulate
1,867
2,079
22,328
6,320
7,341
17.5
19.8
72.7
96.6
25.7
19.3
4.5
3.8
16.7
18.7
3.5
2.9
Aurobindo Pharma
Accumulate
761
823
44,568
17,086
19,478
22.1
22.0
44.7
51.4
17.0
14.8
3.8
3.0
24.7
22.7
2.7
2.4
Aventis*
Neutral
4,161
-
9,583
2,508
2,862
16.8
16.8
139.9
153.8
29.7
27.1
4.3
3.5
23.5
25.8
3.4
2.8
Cadila Healthcare
Reduce
491
426
50,307
11,584
13,228
20.3
20.4
18.7
21.3
26.3
23.1
5.9
4.8
24.6
22.9
4.2
3.6
Cipla
Sell
623
458
50,156
16,619
19,437
15.4
16.2
19.7
24.3
31.6
25.7
3.6
3.2
12.0
13.2
3.2
2.7
Dr Reddy's
Neutral
2,395
-
39,714
15,844
17,973
17.6
18.2
91.7
111.0
26.1
21.6
3.0
2.7
11.9
13.0
2.7
2.4
GSK Pharma*
Neutral
2,531
-
21,439
3,260
3,651
15.0
18.0
46.1
58.6
54.9
43.2
11.3
11.6
20.0
26.5
6.5
5.9
Indoco Remedies
Sell
272
153
2,503
1,154
1,310
14.9
14.9
11.3
12.7
24.0
21.4
3.4
3.0
15.0
15.0
2.3
2.0
Stock Watch
October 30, 2017
Company Name
Reco
CMP
Target
Mkt Cap
Sales ( Čcr )
OPM(%)
EPS (Č)
PER(x)
P/BV(x)
RoE(%)
EV/Sales(x)
(Č)
Price ( Č)
( Č cr )
FY18E FY19E
FY18E
FY19E
FY18E
FY19E
FY18E
FY19E
FY18E
FY19E
FY18E
FY19E
FY18E
FY19E
Pharmaceuticals
Ipca labs
Neutral
524
-
6,616
3,593
4,022
14.5
15.5
19.4
25.2
27.0
20.8
2.5
2.2
9.5
11.2
1.9
1.7
Lupin
Buy
1,001
1,467
45,218
18,657
21,289
21.3
23.3
52.8
66.7
19.0
15.0
2.9
2.4
16.3
17.5
2.4
2.0
Natco Pharma
Accumulate
965
1,057
16,816
1,886
2,016
32.3
29.5
23.2
22.0
41.7
43.8
8.7
7.7
20.9
17.6
8.8
8.2
Sun Pharma
Neutral
550
-
132,043
32,899
36,451
26.9
25.4
31.6
32.3
17.4
17.0
3.1
2.7
18.7
18.8
3.6
3.1
Syngene International
Accumulate
501
557
10,021
1,402
1,823
32.8
36.0
15.9
20.7
31.6
24.3
5.9
4.9
18.7
20.0
7.1
5.5
Power
Tata Power
Neutral
85
-
23,058
32,547
33,806
20.5
20.5
4.7
5.4
18.1
15.9
1.7
1.5
10.5
10.5
1.7
1.6
NTPC
Neutral
182
-
150,438
86,070
101,246
28.3
30.7
12.9
16.2
14.1
11.3
1.5
1.4
10.6
12.4
3.1
2.8
Power Grid
Accumulate
211
223
110,491
29,183
32,946
89.7
90.0
18.0
20.8
11.8
10.2
2.0
1.7
17.7
18.2
7.7
7.2
Real Estate
Prestige Estate
Neutral
301
-
11,278
4,607
5,146
21.0
22.2
7.9
9.8
38.1
30.7
2.3
2.2
10.3
12.0
3.6
3.3
MLIFE
Accumulate
462
522
2,372
487
590
12.3
17.8
21.0
31.2
22.0
14.8
1.2
1.1
5.2
7.4
3.6
2.9
Telecom
Bharti Airtel
Neutral
485
-
193,914
97,903
105,233
36.0
36.3
9.3
11.1
52.2
43.9
2.5
2.4
5.0
5.6
2.9
2.7
Idea Cellular
Neutral
93
-
33,544
35,012
37,689
27.1
27.7
(4.4)
(2.7)
1.5
1.5
(6.8)
(4.6)
2.3
2.0
zOthers
Abbott India
Neutral
4,301
-
9,139
3,244
3,723
14.9
16.1
167.5
209.4
25.7
20.5
5.7
4.7
23.7
24.8
2.5
2.1
Asian Granito
Buy
485
570
1,458
1,169
1,286
12.5
12.5
16.0
19.7
30.4
24.6
3.2
2.9
10.7
11.6
1.5
1.3
Bajaj Electricals
Neutral
385
-
3,912
4,646
5,301
6.7
7.6
16.1
22.3
23.9
17.3
3.9
3.3
16.4
19.2
0.8
0.7
Banco Products (India)
Neutral
215
-
1,535
1,530
1,695
13.2
12.7
19.0
20.0
11.3
10.7
1.8
1.6
0.2
0.2
0.9
101.4
Coffee Day Enterprises
Neutral
222
-
4,566
3,494
3,913
17.4
18.0
4.8
5.7
-
38.9
2.0
1.9
-
0.1
1.8
1.5
Ltd
Elecon Engineering
Neutral
73
-
820
171
201
15.0
16.2
36.0
43.0
2.0
1.7
0.2
0.2
0.1
0.1
4.2
3.5
Garware Wall Ropes
Neutral
943
-
2,062
928
1,003
15.2
15.2
39.4
43.2
23.9
21.8
3.9
3.4
16.5
15.4
2.1
1.9
Goodyear India*
Neutral
808
-
1,864
1,717
1,866
11.8
12.3
47.9
49.8
16.9
16.2
2.6
2.3
15.6
15.7
0.8
111.8
Hitachi
Neutral
2,379
-
6,470
2,355
2,715
10.3
10.8
49.0
60.9
48.6
39.1
11.4
9.0
0.2
0.2
2.8
2.4
HSIL
Neutral
410
-
2,963
2,240
2,670
14.6
15.0
17.0
22.0
24.1
18.6
2.0
1.9
0.1
0.1
1.5
1.2
Interglobe Aviation
Neutral
1,202
-
43,491
22,570
27,955
14.2
15.0
63.6
81.8
18.9
14.7
10.0
8.4
0.5
0.6
1.6
1.2
Jyothy Laboratories
Neutral
375
-
6,811
1,781
2,044
14.1
15.0
9.4
10.5
40.1
35.7
8.5
8.0
0.2
0.2
4.0
3.5
Linc Pen & Plastics
Neutral
247
-
364
420
462
9.3
9.3
15.3
17.1
16.1
14.4
2.7
2.8
16.9
19.5
0.9
0.8
M M Forgings
Neutral
846
-
1,021
542
642
20.1
21.0
41.6
56.8
20.3
14.9
2.8
2.4
0.1
0.2
2.3
2.0
Mirza International
Neutral
159
-
1,913
1,148
1,285
18.0
18.0
8.0
9.4
19.8
17.0
3.3
2.8
16.3
16.1
1.8
1.6
Navkar Corporation
Buy
193
265
2,746
561
617
41.5
41.5
11.5
12.7
16.7
15.2
1.8
1.6
10.5
10.4
5.6
4.9
Nilkamal
Neutral
1,600
-
2,388
2,317
2,525
11.4
11.1
96.0
105.0
16.7
15.2
2.8
2.5
0.2
0.2
1.0
0.9
Stock Watch
October 30, 2017
Company Name
Reco
CMP
Target Mkt Cap
Sales ( Čcr )
OPM(%)
EPS (Č)
PER(x)
P/BV(x)
RoE(%)
EV/Sales(x)
(Č)
Price ( Č)
( Č cr )
FY18E FY19E FY18E FY19E FY18E FY19E FY18E FY19E FY18E FY19E FY18E FY19E FY18E FY19E
zOthers
Parag Milk Foods
Neutral
264
-
2,223
1,987
2,379
7.6
9.0
12.4
18.3
21.3
14.4
3.0
2.6
8.2
13.2
1.2
1.0
Radico Khaitan
Neutral
214
-
2,844
1,811
1,992
13.2
13.2
8.1
8.8
26.4
24.3
2.7
2.9
10.1
12.0
1.9
1.7
Relaxo Footwears
Neutral
529
-
6,351
1,981
2,310
13.7
14.5
12.0
15.5
44.1
34.1
8.6
6.9
0.2
0.2
3.3
2.8
Siyaram Silk Mills
Accumulate
605
650
2,838
1,769
1,981
12.7
12.7
22.6
26.2
26.8
23.1
4.1
3.6
15.5
15.5
1.8
1.6
Styrolution ABS India* Neutral
1,029
-
1,810
1,800
1,980
8.0
8.1
42.0
46.2
24.5
22.3
2.7
2.4
0.1
0.1
1.1
1.0
Surya Roshni
Neutral
377
-
1,654
4,870
5,320
7.7
7.8
22.8
28.1
16.6
13.4
2.2
1.9
0.1
0.1
0.6
0.5
TVS Srichakra
Neutral
3,076
-
2,355
2,729
2,893
12.7
12.5
248.5
265.0
12.4
11.6
3.5
2.9
0.3
0.3
0.9
0.8
Visaka Industries
Neutral
677
-
1,074
1,104
1,214
12.1
12.6
31.0
37.9
21.8
17.9
2.7
2.4
0.1
0.1
1.2
1.1
VIP Industries
Accumulate
279
300
3,941
1,450
1,693
10.4
10.5
6.5
7.8
42.6
35.7
9.0
7.9
21.1
22.1
2.7
2.3
Navin Fluorine
Neutral
734
-
3,621
945
1,154
22.4
22.6
28.7
34.8
25.6
21.1
4.2
3.6
-
-
3.4
2.6
Source: Company, Angel Research; Note: *December year end; #September year end; &October year end; Price as on October 27, 2017
Market Outlook
October 30, 2017
Research Team Tel: 022 - 39357800
DISCLAIMER
Angel Broking Private Limited (hereinafter referred to as “Angel”) is a registered Member of National Stock Exchange of India
Limited,Bombay Stock Exchange Limited and Metropolitan Stock Exchange Limited. It is also registered as a Depository Participant with
CDSL and Portfolio Manager with SEBI. It also has registration with AMFI as a Mutual Fund Distributor. Angel Broking Private Limited is a
registered entity with SEBI for Research Analyst in terms of SEBI (Research Analyst) Regulations, 2014 vide registration number
INH000000164. Angel or its associates has not been debarred/ suspended by SEBI or any other regulatory authority for accessing
/dealing in securities Market. Angel or its associates/analyst has not received any compensation / managed or
co-managed public offering of securities of the company covered by Analyst during the past twelve months.
This document is solely for the personal information of the recipient, and must not be singularly used as the basis of any investment
decision. Nothing in this document should be construed as investment or financial advice. Each recipient of this document should make
such investigations as they deem necessary to arrive at an independent evaluation of an investment in the securities of the companies
referred to in this document (including the merits and risks involved), and should consult their own advisors to determine the merits and
risks of such an investment.
Reports based on technical and derivative analysis center on studying charts of a stock's price movement, outstanding positions and
trading volume, as opposed to focusing on a company's fundamentals and, as such, may not match with a report on a company's
fundamentals. Investors are advised to refer the Fundamental and Technical Research Reports available on our website to evaluate the
contrary view, if any.
The information in this document has been printed on the basis of publicly available information, internal data and other reliable
sources believed to be true, but we do not represent that it is accurate or complete and it should not be relied on as such, as this
document is for general guidance only. Angel Broking Pvt. Limited or any of its affiliates/ group companies shall not be in any way
responsible for any loss or damage that may arise to any person from any inadvertent error in the information contained in this report.
Angel Broking Pvt. Limited has not independently verified all the information contained within this document. Accordingly, we cannot
testify, nor make any representation or warranty, express or implied, to the accuracy, contents or data contained within this document.
While Angel Broking Pvt. Limited endeavors to update on a reasonable basis the information discussed in this material, there may be
regulatory, compliance, or other reasons that prevent us from doing so.
This document is being supplied to you solely for your information, and its contents, information or data may not be reproduced,
redistributed or passed on, directly or indirectly.
Neither Angel Broking Pvt. Limited, nor its directors, employees or affiliates shall be liable for any loss or damage that may arise from
or in connection with the use of this information.